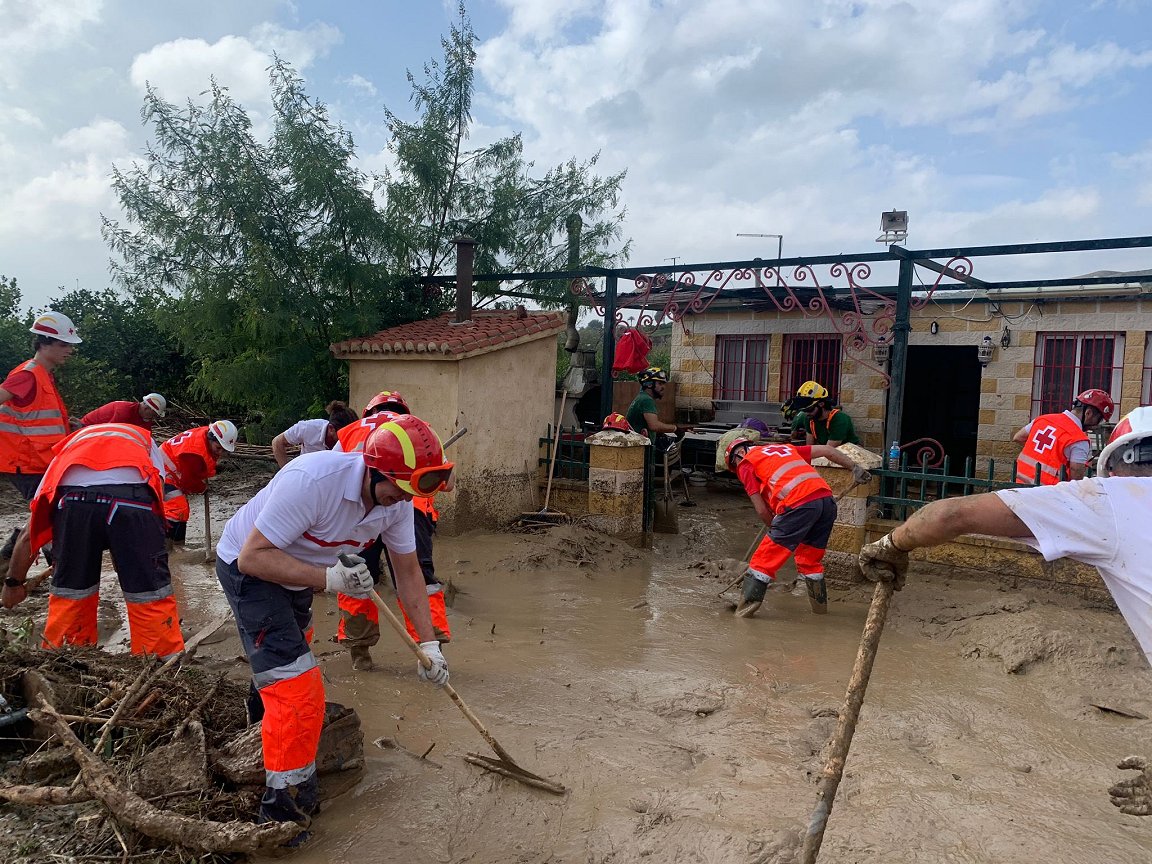
Subsequent floods killed more than 200 people, displaced more than 400 people, and saw hundreds of thousands lose access to water and electricity (GDACS, 2024). The death toll is the highest in a flood event in Europe since 1967 and is expected to rise further in coming days (BBC, 2024).
In the Mediterranean region of eastern Spain, extreme precipitation events such as the one observed, are frequently driven by the presence of an upper-tropospheric cut-off low (COL; known as DANA in Spanish (WMO, 2024), or gota fría, meaning cold drop), which refers to the intrusion of cold air within the COL. At the surface, these systems generate easterly winds that bring warm, moist air inland from the Mediterranean Sea. This air is then forced upward along the complex terrain of eastern Spain, leading to significant rainfall along the coast and often triggering flash floods, locally termed riadas.
The Mediterranean coastline of Spain, particularly the Valencia and Catalonia regions, is highly vulnerable to these floods. Approximately one-third of the most severe floods in this area have been associated with cut-off lows (COLs) (Ferreira 2021). The cut-off low in the higher altitudes, together with very warm air over the Mediterranean, led to large instabilities in the atmosphere which in turn led to strong convection and the very heavy rainfall observed (WMO, 2024).
WWA performed a super rapid analysis, analysing observations only, and therefore this is not a formal attribution study. In addition, we analysed daily precipitation values over a relatively large region rather than the more localised sub-daily precipitation extremes. This means it may underestimate the intensity of heaviest rainfall in particular regions.
Key Messages
- Heavy rainfall was forecast in the most affected region, Valencia, from Friday the 25th, with warnings scaled-up to “significant danger” by the Spanish met service AEMET on the 28th, followed by another warning of “extreme danger” the next morning. Despite the forecasts, many people in the Valencia region only received warnings when the rain had already begun and evacuation was not possible for many (Politico, 2024).
- At the time of writing, the day after the event, only one out of three observation-based datasets that were considered was up-to-date to include the event. Consequently, we can not reliably estimate how rare the heavy rainfall in the worst affected region was, a usual step in attribution analysis. The one data set including the event (MSWEP), suggests a 1 in 20 year event for daily rainfall over a very large region of eastern Spain. However, it is important to note that this does not represent the heaviest rainfall in certain regions that caused devastating floods, like Chiva, which received more than 400 l/sqm in less than 24 hours. This analysis thus serves as a first estimate of the role of human induced climate change.
- To investigate if climate change influenced the heavy rainfall, we determine if there is a trend in the historic rainfall observations in the region,.The three analysed datasets indicate that heavy 1-day rainfall events, as intense as the one observed, are about 12% more intense and about twice as likely in today’s climate, that is 1.3°C warmer than it would have been in the cooler preindustrial climate without human-caused warming.
- These results are based on observational data and do not include climate models that are used in full attribution studies. However, the results are in line with existing evidence of climate change signals in similar past extreme daily-rainfall events that have been studied across Europe. They are also aligned with basic physics and the so-called Clausius-Clapeyron relationship, which outlines that a warmer atmosphere can hold more moisture, resulting in a 7% increase in heavy rainfall with 1°C of warming. We are therefore confident the changes in heavy rainfall are driven by human-caused climate change.
- The results are based on daily rainfall extremes. Many flash floods are driven by extreme rainfall on shorter, sub-daily timescales, of only a few hours. Studies have shown that the intensity of sub-daily events are showing stronger increases driven by human-caused climate change than daily rainfall extremes, globally by about 20% (Ayat et al., 2022). This suggests that the results shown here may be conservative.
- Europe has seen several devastating floods in recent years with very high death tolls, for example, in Germany and Belgium in 2021 where 239 people died and now in Spain. This highlights the urgent need to improve early warning and early action systems that are vital to ensure people are not in harm’s way. Implementing flood management measures such as wetland restoration, and enhancing efforts to address social vulnerabilities to better protect low-income and minority communities at greater risk of flood impacts will also reduce the human cost of devastating floods.
Analysis of trends in extremes
In this short observation-only analysis we examine trends in rainfall extremes like that in southeastern Spain on October 29th.
Observed rainfall
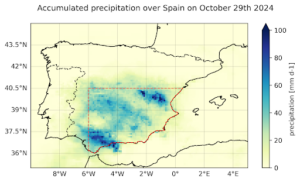
Changes in the observed extreme rainfall are studied by analysing changes in the wettest day each year during September-December, averaged over land areas within an area covering central and southeastern Spain up to 40.5 °N and 6 °W (shown in Figure 1). Three observational and reanalysis datasets are used: MSWEP, ERA5, and EOBS (see appendix for details). The methods used to analyse rainfall trends follow the standard WWA protocol using non-stationary extreme value theory, as described in Philip et al, 2020 and all full study reports (e.g. WWA, 2024 Hurricane Helene).
At the time of writing, which is the day after landfall, only one observation-based dataset includes the event. We therefore use this dataset to estimate the return period of the daily-scale extreme event over the study region and test changes in the probability ratio and magnitude of a similar return period event in the other datasets. The results of this analysis are shown in table 1.
| Dataset | Event | Trends | ||
| Magnitude (mm) | Return period | PR | Change in magnitude | |
| MSWEP | 34.40 | 17.5
(6.90 – 212.03) |
1.42
(0.15 – 1490) |
7.08
(-21.88 – 61.70) |
| ERA5 | 32.55 | 20 | 5.43
(0.31 – inf) |
19.33
(-8.76 – 52.49) |
| EOBS | 27.31 | 20 | 1.90
(0.46 – 105.1) |
10.34
(-11.26 – 46.29) |
| Synthesis | 2.45
(0.18 – 1930) |
12.1
(-16.1 – 56.4) |
||
Table 1: Return period and magnitudes of the event as observed in MSWEP, and magnitudes of the 1 in 20 year rainfall events in ERA5 and EOBS datasets in 2024 in the region over central and eastern Spain shown in figure 1. The probability ratio and change in intensity associated with a 1.3C increase in global mean surface temperature (GMST) are estimated for each dataset, with bootstrapped uncertainties. Finally, the synthesised results for all datasets are shown in the final row.
This analysis builds on a relatively sparse literature on rainfall extremes in the region. Working group 1 of the sixth assessment report of the IPCC found evidence of an increasing trend in rainfall extremes in western and central Europe, but with low confidence of the human contribution to this due to limited agreement (IPCC, 2021). Furthermore, projected changes in such extremes vary strongly by location and season, especially in the study region in this analysis, which suggest a wetting trend in winter and drying in summer (Wood & Ludwig, 2020).
Many of the impacts arising from this rainfall occurred due to localised extremes occurring at sub-daily scales. However, given the timeframe of this analysis, daily-scale data across a broad region was used to assess the return period of the event and its changes with warming. As a result, it is very likely that in some locations the event was far more than a 1 in 20 year event and this return period is not a reliable estimate of localised flooding likelihood. Nonetheless, the rainfall over much of Spain on the whole of October 29th stands out as an extreme event in its own right, due in part to the severity of localised rainfall totals. Furthermore, across Europe, evidence suggests that sub-daily extremes are intensifying with warming more strongly than longer-scale extremes (Wood & Ludwig, 2020). Consequently, while not directly informative as a measure of likelihood, the 1 in 20 year event gives a useful benchmark to analyse changes in similar extremes and also gives an indication of the trend, even though it may underestimate the local return periods and local trends.
In summary, over the past ~75 years, daily rainfall extremes in the September-December season in central and southeastern Spain have increased significantly with global warming, approximately doubling in likelihood and equivalently increasing in intensity by 12%. While a full attribution would require an assessment of trends in climate models as well as observations, the results in Table 1 are in line with other literature on rainfall extremes in the region.

