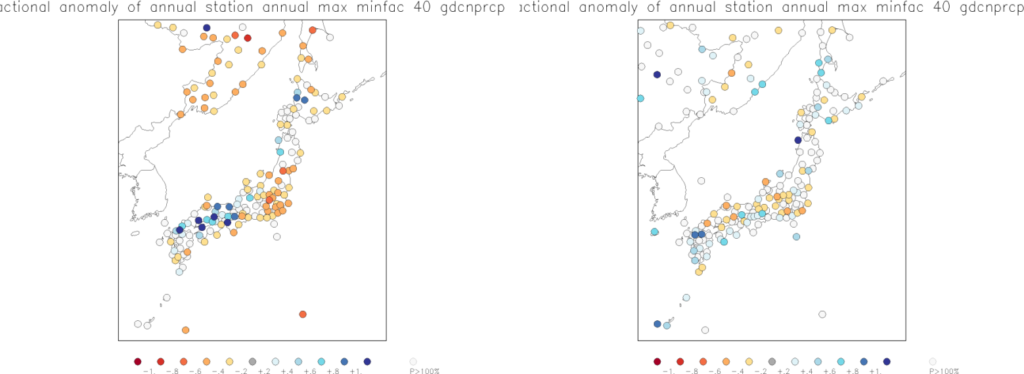
Figure 5. Relative anomalies of the wettest day of the year (RX1day) in 2018 (left) and 2012 (right). A value of zero denotes an extreme like the long-term average; a value of one (dark blue), twice as much rainfall on the wettest day than the long-term average.
