Today, three years after his death, and before the 10-year anniversary of World Weather Attribution, the last paper Geert Jan and I worked on together is published.
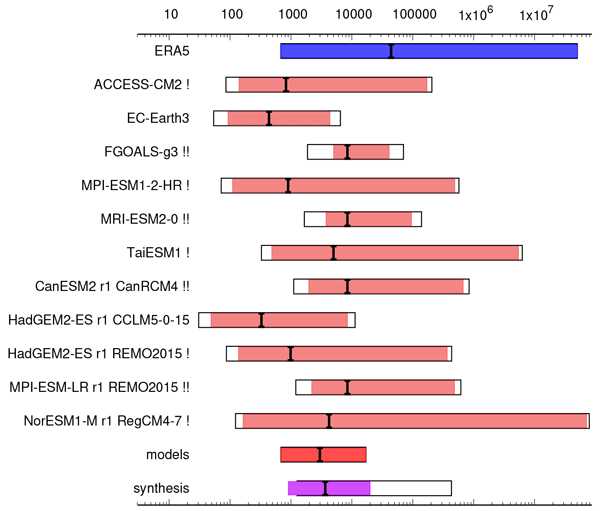
The paper presents a quantitative statistical synthesis method we have developed over the last eight years of conducting rapid probabilistic event attribution study. It is a statistics focused paper, something he liked a lot and something I can do if need be, which is why it was on my desk for so long. It is probably not an exciting read for most. However, being able to combine different lines of evidence into one number, the final result describing the overarching influence of climate change on the intensity and likelihood of an extreme weather event, has been a key milestone in World Weather Attribution’s methodological development and the science of event attribution at large. We call this step the hazard synthesis.
Many attribution studies only use climate models or weather observations, rather than both, or focus on just one aspect of an extreme event, such as the low pressure system that led to very heavy rainfall, but not the role of climate change in resulting rainfall. Our method, using observations and models, and crucially, combining them in the synthesis, more realistically captures the overall influence of climate change on an extreme weather event.
While the ideas presented in the paper were developed with Geert Jan over many years, some of the limitations of the approach have only become apparent in the last few years. For example, it is not possible to estimate how much more likely an extreme weather event has become if the event wouldn’t have been possible in a 1.3°C cooler world without climate change. We’ve seen this in heatwaves in the Mediterranean and the Sahel this year and in Madagascar, Southern Europe and North America, Thailand and Laos last year. When the change in likelihood is infinite, a numerical representation just becomes an illustration that aims to show just how much of a game changer human induced climate change is.
A problem we frequently encounter comes when climate model results don’t agree with the basic physics that governs the weather. We know from the fundamental Clausius-Clapeyron relationship that a warmer atmosphere can hold more water vapour, which leads to heavier downpours – about 7% with each 1°C of global warming. However, when we studied extreme floods in the Philippines, Dubai, or Afghanistan, Pakistan and Iran this year, weather observations showed an increase in heavy rainfall as expected, but the climate models indicated either decreasing rainfall or no change at all.
This disagreement suggests that the models are unable to replicate all the physical processes at work in the real world. Unfortunately, poor model performance is common for countries in the Global South that often have limited means to fund climate science programmes. For short duration events, based on Clausius-Clapeyron, we can point to climate change to explain the increased rainfall. For longer duration events over weeks or months, though, we can’t link the increase to climate change as changing weather patterns may have a role.
When weather observations and climate models do align, we can carry out the synthesis described in the first part of the paper (statistic geeks, you’re welcome!) and confidently report changes to the intensity and likelihood of an event. For example, in 2022, we found that climate change made the deadly heatwave in Argentina and Paraguay was made 60 times more likely, while earlier this month, we found that climate change increased Hurricane Helene’s rainfall by about 10%.
While the methodology in the paper is very statistics-heavy, it also highlights important questions that everyone should ask when evaluating the results of an attribution study:
- Does the statistical model fit the observed data well? Or is the record too short?
- Are the observations we have of high quality? Or are there large discrepancies between different datasets?
- Are the model results consistent between different climate models? Are there any known deficiencies in the climate models?
- Do models and observations agree?
- Do we find different results when looking at higher warming levels?
- Are models and/or observations in line with what we know from physical science, e.g. the Clausius–Clapeyron relationship?
- How do our results compare to other published research or research syntheses such as included in IPCC reports and government assessments?
Often, the answers to these questions are not trivial. They influence how we interpret and communicate the final result. So, if you ever wondered why we don’t just automate the analysis of the hazard, or let AI do it, this is why.
As Geert Jan used to say: “you need time and experience to know when your numbers lie”.
By Friederike Otto, Co-founder of World Weather Attribution


