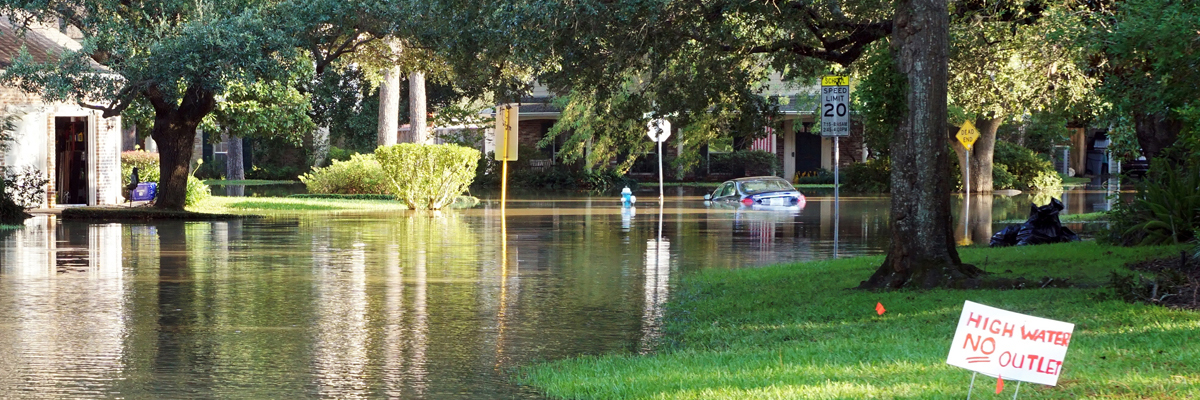
In mid-September 2019, torrential rainfall from Tropical Storm Imelda caused large-scale flooding in Southeast Texas. Authorities have linked five deaths to the floods and over one thousand people had to be rescued, making this the worst storm in the area since Hurricane Harvey.
Key findings:
- The precipitation recorded on 19–20 September 2019 associated with Tropical Storm Imelda was extreme, expected only approx. every 1200 yr at the station with the highest total amount of rainfall. Return times at other stations between East Houston and Beaumont were almost as high. The chances of recording this much precipitation at any of 85 stations along the Gulf Coast is however much higher, at about 1 in 50 years.
- Two standard statistical analyses of the observations show that the probability for such an amount of rain has increased by a factor 2.6 (1.6 to 5.0) since 1900, or equivalently the amount of rainfall in such an event has increased by 18% (11% to 28%) since 1900.
- Taking high-resolution climate models into account, we conclude that two-day extreme precipitation events along the Gulf Coast as intense as observed on 19–20 September 2019 or higher have become 1.6 to 2.6 times more likely due to anthropogenic climate change, or 9% to 17% more intense.
- This study highlights that climate change has clearly led to increased precipitation during extreme events in southeast Texas. Coupled with sea level rise, climate change has resulted in more frequent and intense flooding, especially in coastal areas. This needs to be seen in the context of rapid urban expansion in the area and is characterized by a loss in impervious cover. In part this expansion is driven by population growth. It has resulted in an increase in the number of people and value of property at risk to flooding. An estimated 6.6 million people live in the counties impacted by Imelda.
Introduction
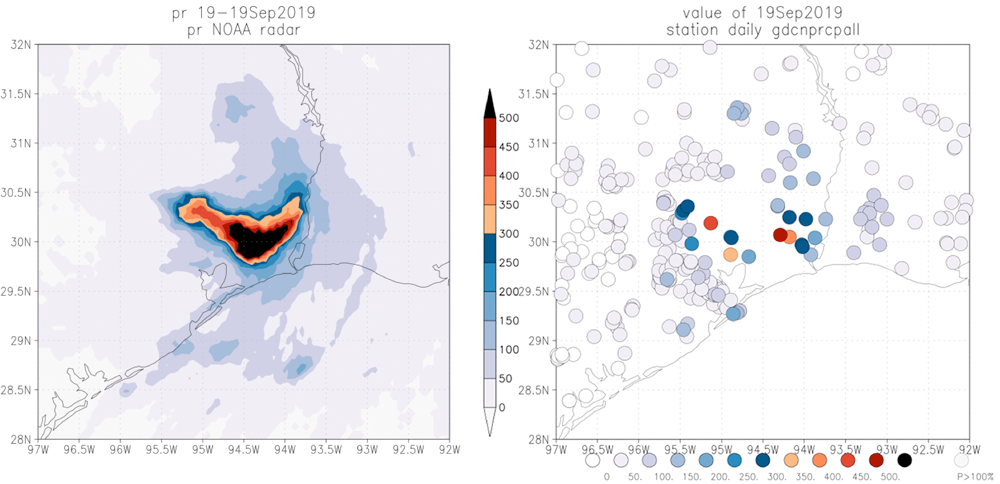
Around 19 September 2019 torrential rainfall from Tropical Storm Imelda caused large-scale flooding in Southeast Texas from Houston to the Louisiana border. Figure 1 shows the highest 1-day precipitation totals from the NOAA calibrated radar (12 UTC 18 September to 12 UTC 19 September), which shows rainfall amounts exceeding 500 mm/day (black) from eastern Houston to Beaumont and the Louisiana border. This is also shown by station data from the GHCN-D v2 dataset. Most stations record precipitation between 8 am and 8 am local time, which corresponds to 13-13 UTC, very close to the time interval of the radar data. The highest daily value recorded at a station is 493.5 mm/day at Beaumont Research Center, Texas. However, given the large amounts of missing data near the maximum defined by the radar data we posit that higher values are likely to be reported at stations that become available with a delay.
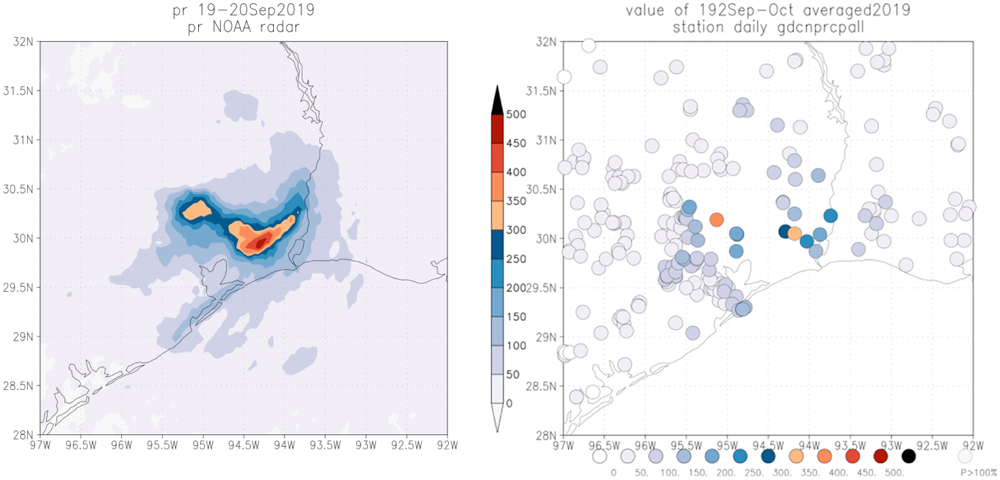
After making landfall on 17 September, Imelda stalled north of Houston on 18 and 19 September. While the storm was downgraded to a Tropical Depression, intense banding contributed to several waves of heavy precipitation across the region creating the horseshoe pattern shown in Figure 1. Furthermore, Imelda’s long residence time and slow forward motion over Southeast Texas generated extremely intense rainfall over relatively small areas, so that the two-day precipitation amounts are even more exceptional in smaller areas. Figure 2 shows the precipitation amounts averaged over the 2-day period 19-20 September 2019. The highest recorded accumulation at any station is 355.3 mm/day, or 710.6 mm/2dy, at Roman Forest 1.9 ENE, Texas.
Observed trends
In the same way as in previous studies on extreme rainfall (in England, France, Chennai, Louisiana and Houston), we fitted a Generalized Extreme Value (GEV) distribution to the NCEI GHCN-D v2 station data that scales with global mean temperature as a proxy for climate change. See Van der Wiel et al. (2017) for a detailed explanation of the procedure, which was also used in the analysis of Hurricane Harvey’s precipitation in Van Oldenborgh et al. (2017). As in the latter publication we use two datasets: 13 stations with at least 80 years of data and at least 1º apart, and 85 stations with at least 30 years of data and at least 0.1º apart. There is one important change in the GHCN-D dataset: an extreme precipitation event in Abbeville on 7–9 August 1940 that had been removed in the version we used for the Harvey analysis has since been reinstated as a correct observation. It has precipitation amounts almost comparable to Harvey and is now visible on the fits. (As an aside, inclusion of this event, plus the data since 2017, does not greatly affect the conclusion of the Harvey analysis in return time, probability ratio or change in intensity, although the uncertainty ranges increase somewhat. The GEV function with positive shape parameter has a large probability for extreme events; that is, the fit is determined more by the many smaller events.)
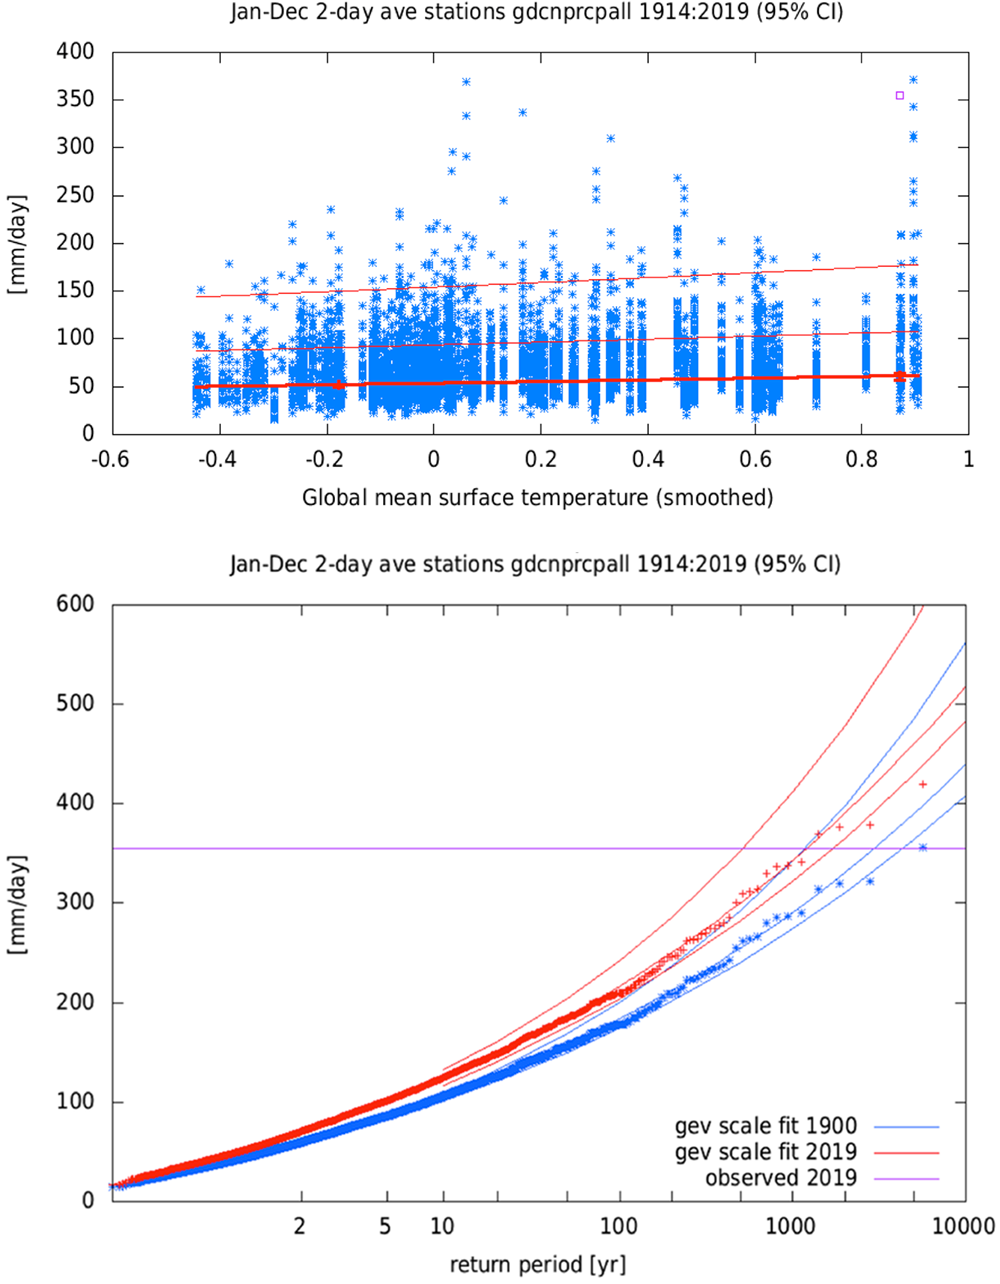
The GEV fits give a local return time in the current climate, the inverse of which gives the probability of as much rain or more than observed at the most extreme station at a given location (a return time of 50 yr means a probability of 2% every year). For one-day precipitation in the 85-station dataset this is about 550 yr (320 to 750 yr) and for the highest two-day precipitation about 1200 yr (520 to 1700 yr, see Figure 3). The results from the 13-station dataset are similar but with slightly larger uncertainties. The event was therefore more extreme as a two-day event than as a one-day event. Given that the Harvey analysis had shown that multiple-day precipitation caused higher floods, we take as event definition the highest two-day station precipitation.
The regional return time for such a high amount at any of the 85 stations with at least 30 years of data and 0.1º apart that we analysed on the U.S. Gulf Coast 27.5–31 ºN, 85–97.5 ºW). This is much higher as the Gulf Coast is much larger than the area with extreme precipitation, so there are many possible locations. We obtain a return period of 50 yr (20 to 200 yr) for this amount of two-day precipitation in any of these stations on the U.S. Gulf Coast. This appears to be somewhat at odds with the recent observations of three similar flooding events in four years (2016, 2017, and 2019). It requires further analysis, beyond what is possible in this rapid attribution study, to find out whether or not the recent recurrence is more than an unfortunate coincidence.
The fit to the observations shown in Figure 3 also gives the results that such an event has become more common by a factor of roughly 2.6 (1.6 to 5.0) since around 1900, or equivalently that the intensity (i.e. total amount of precipitation) increased by about 18% (11% to 28%).
Modelled effects of climate change
We repeated the same analysis for a 6 member ensemble of 5-yr time slices of the SST-driven climate model EC-Earth 2.3 at T799 (~30km) horizontal resolution (Hazeleger et al., 2012), which was found to describe the three-day extremes we studied in our Harvey analysis well. Our usual procedure is to only use climate model output for the present and past to study the dependence of the event on climate change up to now. However, for this model we do not have enough data to extract that information from the past and present data only. We therefore chose to also use the time slice around 2090. This assumes that the effect of climate change is the same in the past as up to this time, when we describe it as a function of historical and scenario equivalent CO2 concentration. The strong heating in the last time slice gives rise to more intense events, as can be seen in Figure 4.
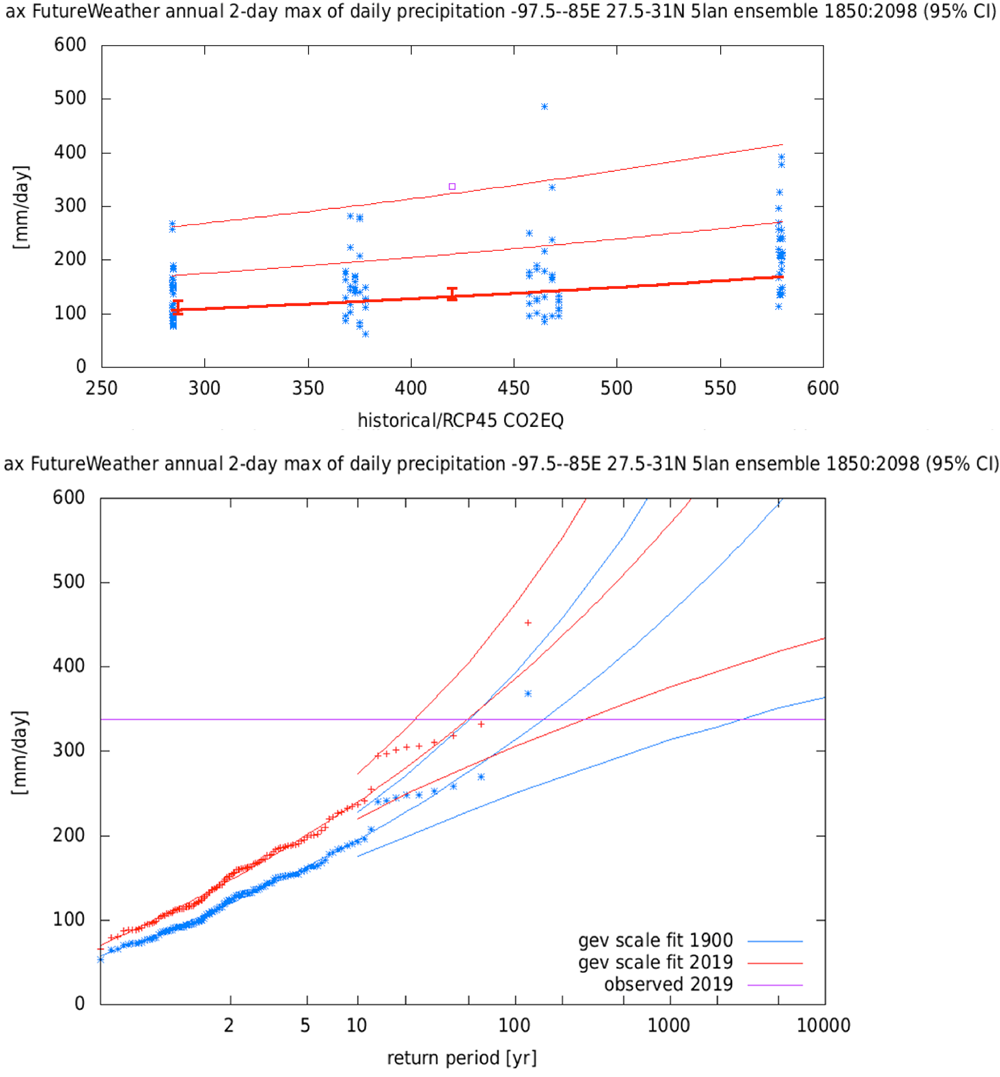
We defined the event to have the same regional return time as in the observations, 50 yr. The fit gives an increase in probability between 1900 and 2019 of 3.1 (1.9 to 12.3) and a change in intensity of 23% (13% to 31%).
We also analysed the other model of the Louisiana and Harvey analysis that simulated three-day extremes reasonably well, HiFLOR (25km, Murakami et al., 2016). We consider again the spatial maximum, now over the land points in 29–31ºN, 85–95ºW, of the annual maximum of two-day averaged precipitation, Figure 5.
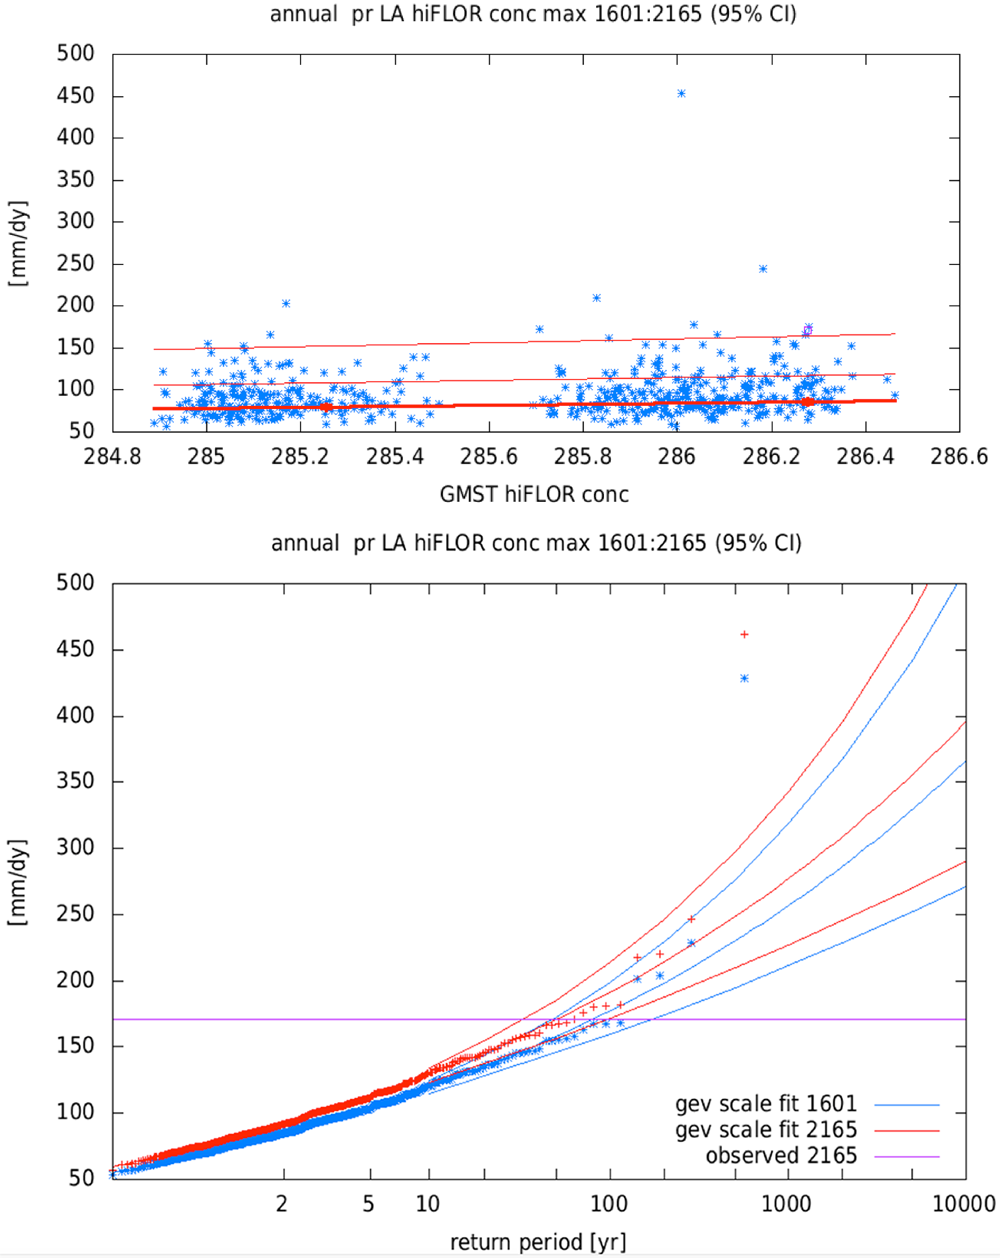
This model gives an increase in probability of a factor 1.6 (1.3 to 2.0), which is equivalent to an increase in intensity of 8% (4% to 12%).
Hazard synthesis
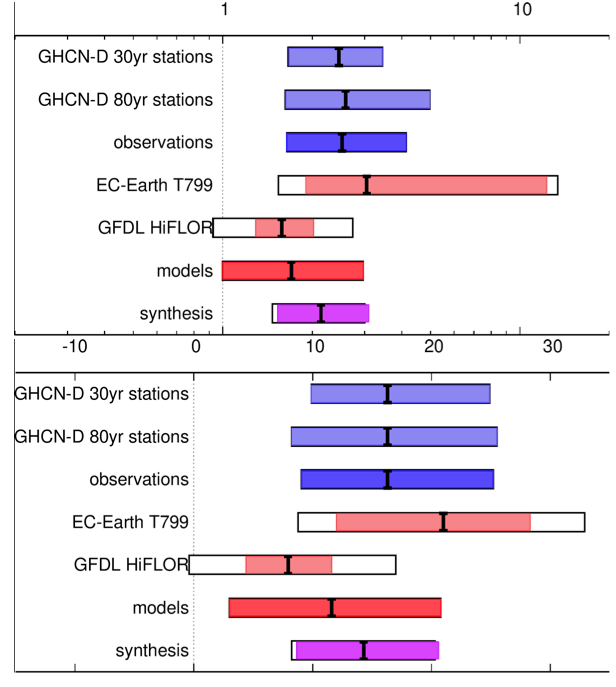
The synthesis plots are shown in Figure 6. For the two observational estimates the natural variability is highly correlated, so the bar labeled ‘observations’ just averages the lower bounds, best fit values and upper bounds. The models are further apart than can be explained by natural variability (red bars). The white extensions denote the model spread necessary to bring the χ²/dof to one (van Oldenborgh et al, in preparation). This has been added to the natural variability to give the ‘models’ summary bar. Finally the observations and models have been averaged using weights (coloured bar) and with equal weights (white box). These almost coincide in this case.
This synthesis shows that the probability of two-day rainfall as intense as the maximum observed during Imelda has increased by a factor 1.5 to 3.1. This is equivalent to an increase in intensity of 9% to 21%.
Vulnerability and exposure
Two years after Harvey, Tropical Storm Imelda again served to highlight the vulnerability of Southeast Texas to severe rainfall. Widespread flooding was reported in Northeast Houston and along the I-10 corridor between Houston and the Golden Triangle (Beaumont-Port Arthur-Orange, largely coinciding with the areas of extreme precipitation of Figures 1 and 2). Several major rivers and bayous in the region exceeded flood stage, including along parts of the San Jacinto, Lower Trinity and Neches Rivers and their tributaries. Flooding also impacted numerous heavily-trafficked roadways catching daytime drivers by surprise. The Harris County Fire Marshal’s Office reported that more than 2,000 water rescues were performed by emergency responders in Harris County, 450 of which involved high water rescues.
In response, Texas’ Governor, Greg Abbott, declared a State of Disaster to provide unlimited state resources to the counties impacted by Imelda. The 13-county disaster declaration area has a population of approximately 6.6 million people. By 21 September, 2,400 flood insurance claims had been filed with the NFIP and the Insurance Council of Texas reports that more than 10,000 vehicles were damaged (80% are estimated to be totaled). It is likely that damages from the event will reach into the billions of dollars. As of 23 September, it was estimated that five deaths had occurred due to Imelda.
Since Harvey, significant steps have been taken to reduce the vulnerability of southeast Texas to coastal flooding. First, several new state laws went into effect on 1 September 2019 including a hazard disclosure law which expands requirements for sellers to disclose flood risk to include past flooding, and whether the home is located in a 500-year floodplain, a flood pool, or near a reservoir. Many homeowners are unaware of their risk and the FEMA flood maps are out of date and do not account for changes in precipitation, or upstream development. (FEMA is set to update its methodology for determining flood risks, which previously only looked at historical information, by 2020.)
Second, the state legislature created several funding mechanisms to facilitate the construction of flood control infrastructure including the Flood Infrastructure Fund and the Texas Infrastructure Resiliency Fund (TIRF). The Infrastructure Fund was created using nearly $1.7 billion from the state’s savings account, colloquially known as the “rainy day fund,” to be used to build flood control infrastructure in the short term. The Texas Infrastructure Resiliency Fund (TIRF), totaling $1.6 billion, will provide cities, counties and other political subdivisions the opportunity to apply for grants and low- or zero-interest loans that can then be used as the “match” for federally funded projects.
The Texas legislature also passed two bills aimed at improving planning and emergency response statewide: SB6 increases training for emergency managers in the state and provide guidance for disaster response and recovery and SB8 creates a statewide flood plan which will be published every five years and consist of a consolidated list of flood control infrastructure projects and community initiatives.
Finally, the National Oceanographic and Atmospheric Administration (NOAA) recently updated the intensity-duration-frequency (IDF) curves used for infrastructure design and planning including to delineate flood risks and manage development in floodplains in relation to the National Flood Risk Insurance Program. This update has resulted in an increase in return period rainfall estimates. For example, in Houston, rainfall totals events that were previously classified as 1-100 year events are now 1-25 year events (ibid). (This relative increase is in line with our findings in the attribution of Harvey’s rainfall to climate change, Van Oldenborgh et al, 2017.)
Conclusion
Analyses of the flooding events of the last few years (Van der Wiel et al, 2017; Van Oldenborgh et al, 2017; Risser and Wehner, 2017 and others) have shown that the probability of extreme rainfall on the U.S. Gulf Coast has clearly increased, and climate models indicate that this increase can be connected to changes in climate. Coupled with rapid urbanization characterized by a loss in impervious cover, climate change has resulted in more frequent and intense flooding (Zhang et al. 2018). In this rapid attribution analysis we find the two-day extreme precipitation of Tropical Storm Imelda was also increased substantially by anthropogenic global warming.
Since Harvey (August 2017), significant steps have been taken to reduce risk and increase resilience to floods in southeast Texas, for example by increasing public awareness of flood risks, improving disaster preparedness, response, and recovery, and providing a mechanism for planning and funding for large-scale infrastructure projects. However, as demonstrated by Imelda, extreme weather events will continue to increase in severity as long as climate warming from increasing concentrations of greenhouse gases continues. Further research is needed to evaluate the potential role of climate change in having three of the past four years exhibit events with such high observed rates of extreme precipitation and resulting flooding.
References
Hazeleger et al, 2012. EC-Earth V2.2: description and validation of a new seamless earth system prediction model. Climate Dynamics. 39: 2611-2629, doi:10.1007/s00382-011-1228-5.
Murakami et al, 2016. Seasonal Forecasts of Major Hurricanes and Landfalling Tropical Cyclones using a High-Resolution GFDL Coupled Climate Model. Journal of Climate, 29: 7977–7989, doi:10.1175/JCLI-D-16-0233.1.
M.D. Risser and M.F. Wehner, 2017. Attributable Human-Induced Changes in the Likelihood and Magnitude of the Observed Extreme Precipitation during Hurricane Harvey. Geophysical Research Letters, 44: 12,457–12,464, doi:10.1002/2017GL075888.
G.J. van Oldenborgh et al, 2017. Attribution of extreme rainfall from Hurricane Harvey, August 2017. Environmental Research Letters, 12: 124009, doi:10.1088/1748-9326/aa9ef2
van der Wiel et al, 2017. Rapid attribution of the August 2016 flood-inducing extreme precipitation in south Louisiana to climate change. Hydrology and Earth System Sciences, 21: 897–921, doi:10.5194/hess-21-897-2017
Zhang et al, 2018. Urbanization exacerbated the rainfall and flooding caused by hurricane Harvey in Houston. Nature, 563(7731): 384. doi:10.1038/s41586-018-0676-z


