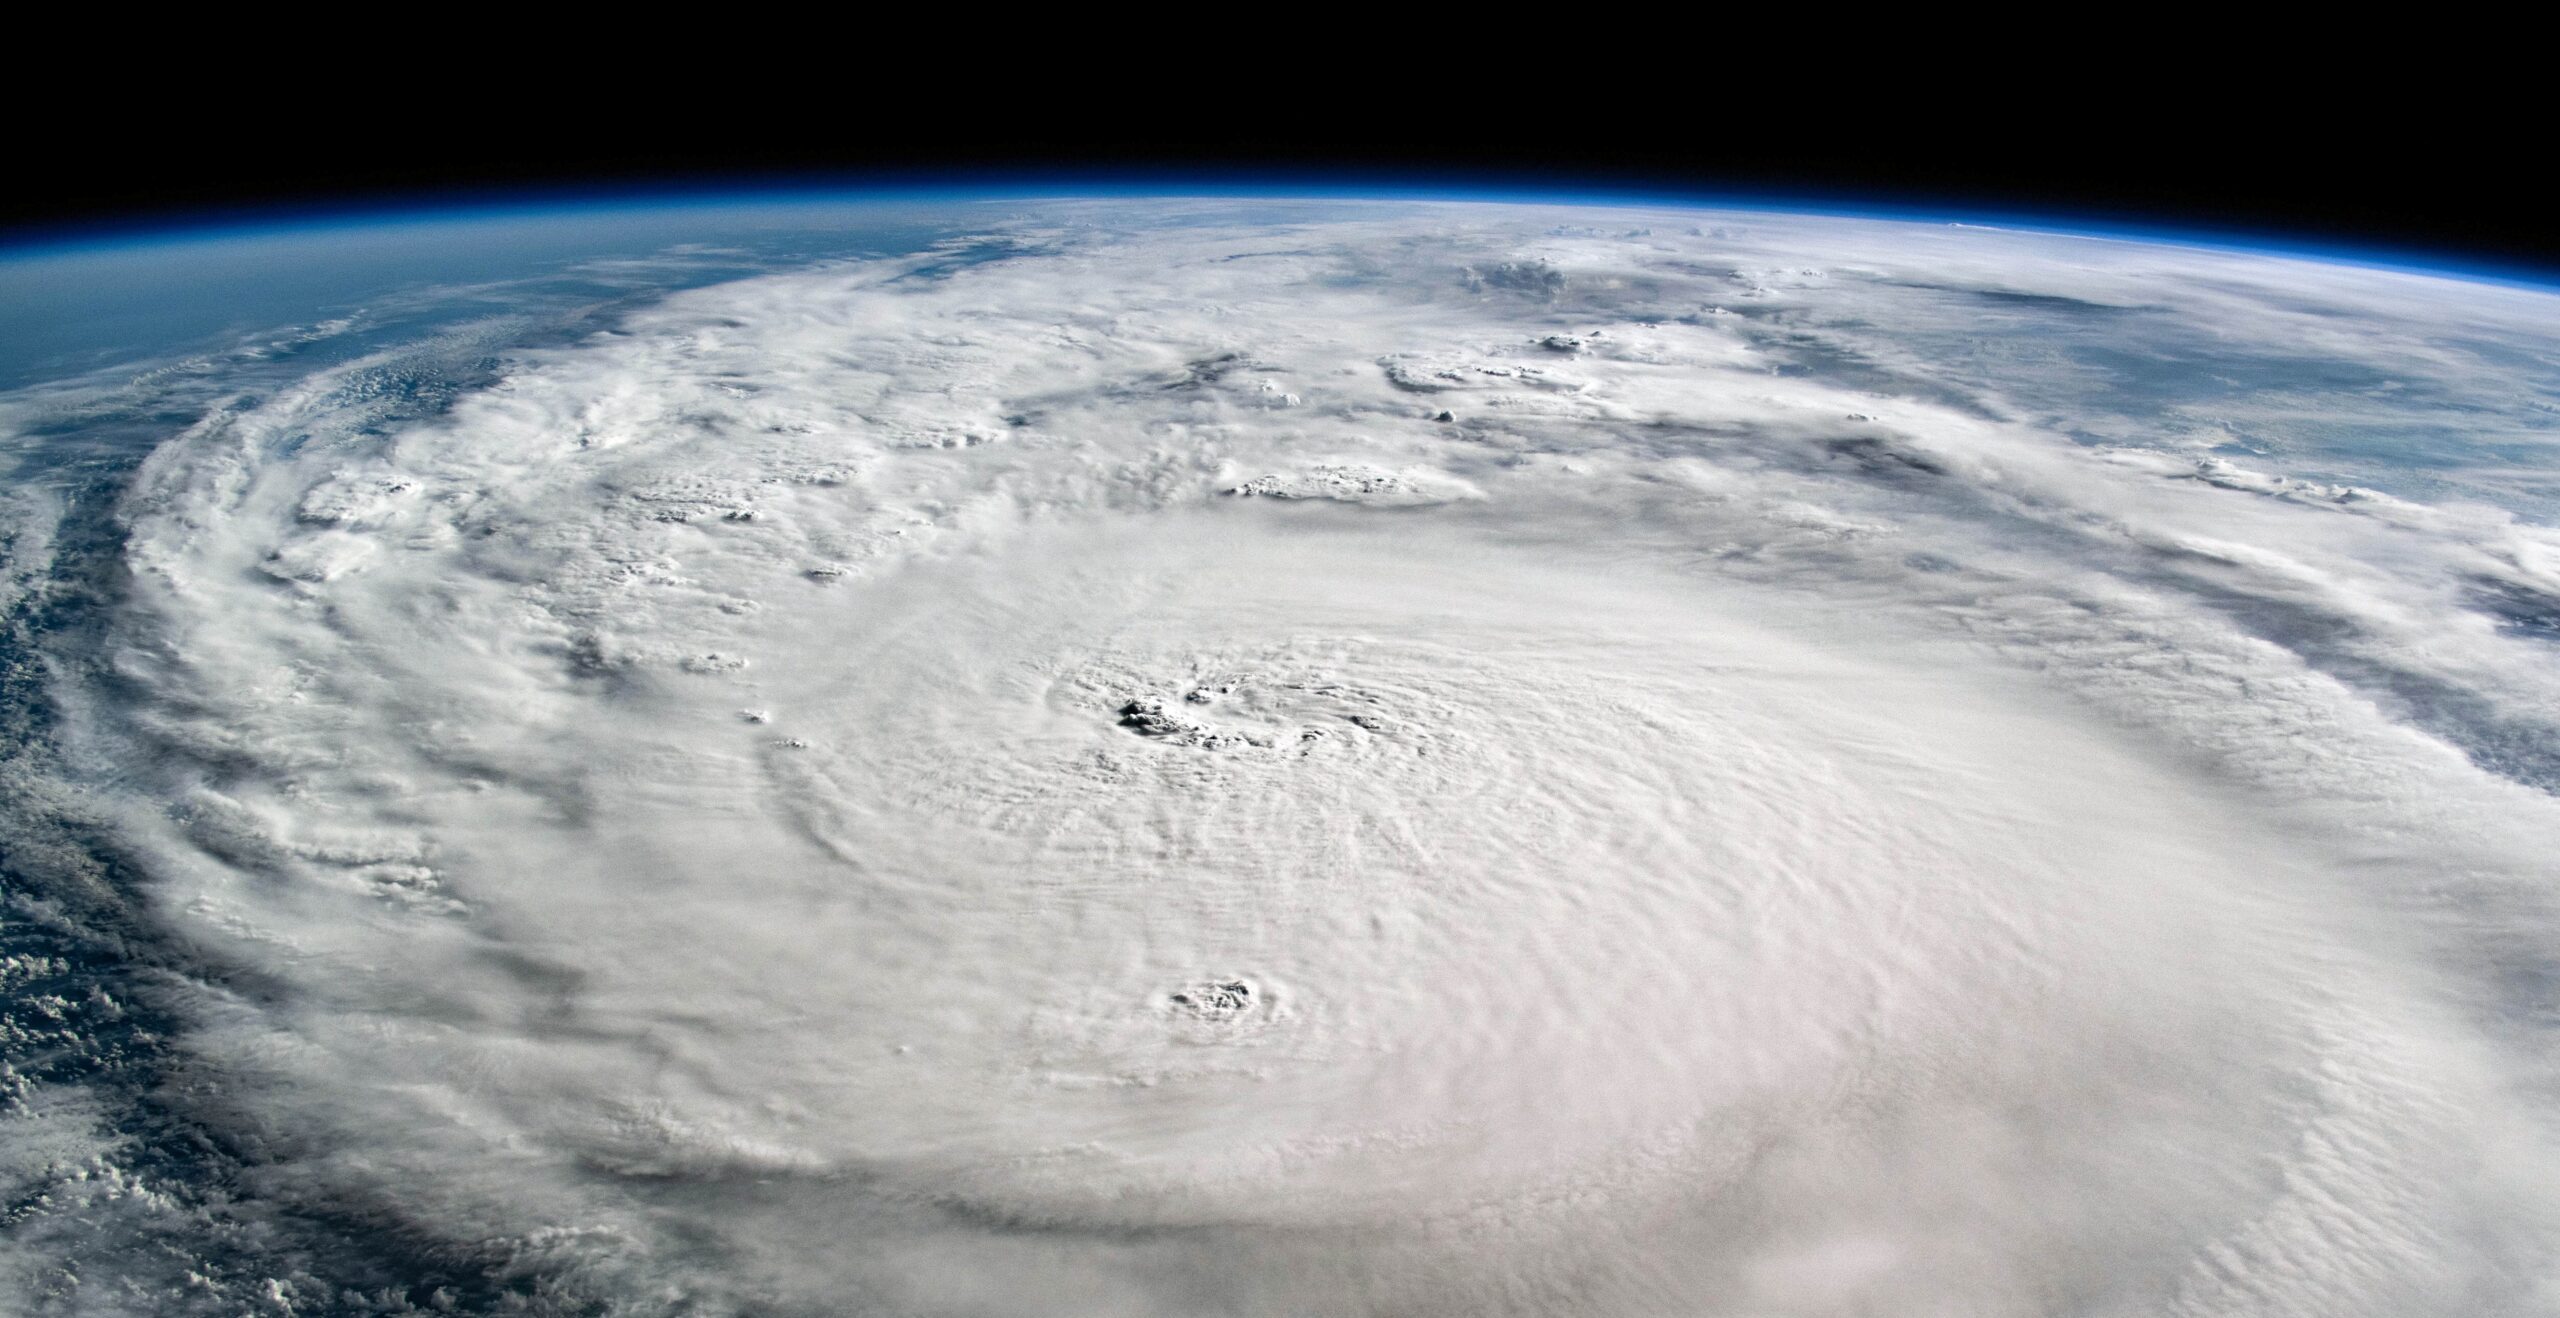
Hurricane Milton began as a tropical depression in the Gulf of Mexico on Saturday 5th October. It very rapidly intensified to tropical storm status, before undergoing explosive intensification to a high category 5 between Sunday 6th and Monday 7th, as it moved southeast towards the Yucatan Peninsula (NOAA, 2024), where the central pressure fell to below 900 mbar (NHC, 2024). This was driven and sustained by the very high sea surface temperatures in the Gulf, which previous analysis has shown to have been made 400-800 times more likely by climate change (Climate Central, 2024). Milton then turned northeast, closing in on central Florida, in a path very close to both Tampa and Orlando. Its intensity decreased slightly to Category 3 by the time of landfall on the evening of the 9th, bringing high winds, extreme rainfall and storm surges of 5-10 feet (Miami NBC, 2024) to the western coast of Florida, before moving directly across the low-lying peninsula.
While still working on the impacts of hurricane Helene that hit only two weeks earlier (WWA, 2024), the authorities put over 1,000 first responders and more than 1,400 search and rescue personnel on the ground to support people in the path of Milton (FEMA, 2024). In addition, government authorities urged people to evacuate the area and provided free shuttles for people living in the predicted path of Milton, and issued a range of statements against misinformation (FEMA, 2024b). Over 7 million people live in the area with mandatory evacuation orders, though some did not or were unable to comply (Axios, 2024). The hurricane spawned dozens of tornadoes that resulted in many of the deaths (AP News, 2024). The full impacts of the hurricane will only be known in the days and weeks to come. At the time of writing, 16 people are confirmed to have lost their lives while more than three million are without electricity (Tampa Bay Times, 2024; New York Times, 2024; Independent, 2024).
Key Messages
- Milton formed in the Gulf of Mexico and intensified in the course of only two days into a Category 5 hurricane. It followed in the wake of Hurricane Helene that made landfall less than two weeks before Milton. Both the rapid intensification and the fact that emergency personnel were still continuing with the recovery from Helene made preparations difficult. Despite this, many people in the immediate path evacuated and the losses and damages from Milton are much smaller than from Helene. However, the full extent of the compounding impacts from the hurricanes will only be known in the weeks to come.
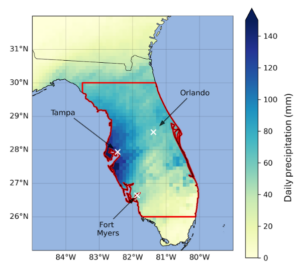
- At the time of writing, the day after landfall, the observation-based datasets are not all updated to include the event. We can thus not reliably estimate how rare the heavy rainfall in the path of Milton was, a usual step in attribution analysis. Instead, we assessed trends in observations for an estimated 1 in 10 year and a 1 in 100 year event in the region indicated in figure 1. In both cases the results are comparable and thus not very sensitive to the exact event definition.
- To estimate if human-induced climate change influenced the heavy rainfall, we determine if there is a trend in the observations. In three out of the four analysed datasets we find that heavy 1-day rainfall events such as the one associated with Milton are 20-30% more intense and about twice as likely in today’s climate, that is 1.3°C warmer than it would have been without human-induced climate change. The fourth dataset shows much larger changes.
- These results are based on observational data and do not include climate models and are thus higher than the overarching attribution statement given for Hurricane Helene, where we combined observations and climate models. Nevertheless the results are compatible with those obtained for other hurricanes in the area that have been studied in the scientific literature. Despite using different temporal and geographical event definitions, as well as different observational datasets and climate models, all these studies show a similar increase in intensity of between 10 and 50% and about a doubling in likelihood. We are therefore confident that such changes in heavy rainfall are attributable to human-caused climate change.
- The IRIS model was used to investigate Milton’s strong winds by analysing storms making landfall within 2 degrees of Milton. By statistically modelling storms in a 1.3°C cooler climate, this model showed that climate change was responsible for an increase of about 40% in the number of storms of this intensity, and equivalently that the maximum wind speeds of similar storms are now about 5 m/s (around 10%) stronger than in a world without climate change. In other words, without climate change Milton would have made landfall as a Category 2 instead of a Category 3 storm.
- Hurricane-prone Florida has measures in place to reduce impacts, though most adaptation measures are reactive, rather than preventative. The Resilient Florida Grant Program, established in 2021, strengthens local government’s capacity to address the impacts of climate change, through vulnerability assessments, adaptation plans, strengthening coastal defences, and community outreach. Since Hurricane Michael in 2018, the Florida Building Code has been updated twice, and is amongst the toughest in Gulf and Atlantic Coast states. The state has opportunities to further integrate nature-based solutions, such as wetland restoration, and to enhance efforts to address social vulnerabilities to better protect low-income and minority communities at greater risk of flood impacts.
Analysis of trends in extremes
In this short report we examine trends in rainfall extremes like that from Hurricane Milton, and attribute changes in wind speeds from similar events using the IRIS storm model. We compare this to results from the recent rapid attribution study for Helene and other work attributing similar storms in the literature.
Observed rainfall
Changes in the rainfall from Milton are studied by analysing changes in the wettest day each year during June-November, averaged over land areas within an area covering central Florida bounded by the coordinates 26-30 °N and 79.5-83.5 °W (shown in Figure 1). Four observational and reanalysis datasets are used: MSWEP, ERA5, CHIRPS and CPC (see appendix for details). The methods used to analyse rainfall trends follow the standard WWA protocol using non-stationary extreme value theory, as described in Philip et al, 2020 and all full study reports (e.g. WWA, 2024).
At the time of writing, the day after landfall, the observation-based datasets have not all been updated to include the event. We can thus not reliably estimate how rare the heavy rainfall in the path of Milton was. Instead, we estimated changes in likelihood and magnitude for a 1 in 10 year and a 1 in 100 year event. The results of this analysis are shown in table 1.
| Dataset | 1 in 10 year event | 1 in 100 year event | Magnitude change (%) | ||
| Magnitude (mm) | Probability ratio | Magnitude (mm) | Probability ratio | ||
| ERA5 | 66.97 | 2.29
(0.68 – 8.10) |
143.97 | 2.50
(0.65 – 13.09) |
33.15
(-11.33 – 101.88) |
| CHIRPS | 74.38 | 32.69
(0.33 – inf) |
104.91 | 287.70
(0.35 – inf) |
60.46
(-9.80 – 187.0) |
| MSWEP | 72.81 | 1.95
(0.30 – 8380) |
144.13 | 2.18
(0.12 – inf) |
23.46
(-34.57 – 171.71) |
| CPC | 78.06 | 1.92
(0.15 – 4.58) |
162.69 | 2.08
(0.001 – 6.24) |
24.51
(-21.65 – 84.97) |
| Synthesis | 4.09
(0.09 – 3240) |
7.56
(0.009 – 80000) |
34.6
(-24.2 – 145) |
||
Table 1: Magnitudes of 1 in 10 and 1 in 100 year rainfall events in 2024 in the region over central Florida shown in figure 1. The probability ratio and change in intensity associated with a 1.3C increase in global mean surface temperature (GMST) are estimated for each event, with bootstrapped uncertainties Due to the scaling assumption built into the statistical model, the change in magnitude is the same for events of all return periods. Finally, the synthesised results for all datasets are shown in the final row.
In summary, over the past ~75 years, rainfall extremes in central Florida have increased significantly with global warming. While a full attribution would require an assessment of trends in climate models as well as observations, the results in Table 1 are in line with those of Hurricane Helene and other literature on hurricanes in the region. The results for individual datasets shown in Table 1 show changes in response to GMST that are very similar to the observational results for Hurricane Helene (see Table A.2). We would therefore expect the overall attribution result to be comparable, with climate models showing weaker (but still positive) trends in response to climate change and the synthesised results indicating with high confidence that the rainfall was increased in both likelihood and intensity to a similar level as the coastal region for Hurricane Helene (WWA, 2024).
Wind intensity
The IRIS synthetic storm model (Sparks and Toumi, 2024), developed at the Grantham Institute and previously set out here, is used to study the change in likelihood and intensity of the high wind speeds associated with storms similar to Milton. This is defined by changes in those storms making landfall at Milton’s intensity, within Category 3, and geographically within 2 degrees of Milton’s landfall on the west coast of Florida (figure 2).
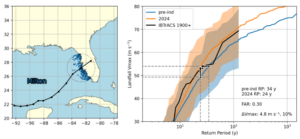
This analysis finds that storms with Milton’s wind speeds have become approximately 40% more frequent; equivalently, winds associated with storms of similar rarity have become nearly 5 m/s more intense, due to 1.3 °C of global warming (figure 2). In practice, this means that without climate change Hurricane Milton would have been a Category 2 rather than a Category 3 hurricane when it made landfall.
Sea Surface Temperatures
Climate Central’s Climate Shift Index: Ocean (Ocean CSI) tool was recently used to rapidly compute the influence of human-caused climate change on Sea Surface Temperatures along Hurricane Milton track. Here we summarise their methods and main findings.
The methodology underpinning the CSI Oceans tool is based on peer-reviewed research (Giguere et. al, 2024). It uses a combination of an empirically-driven attribution method usually using the observed SSTs in OISST data (Huang et. al, 2021), but due to the impacts of Helene on the daily updates from NOAA’s National Centers for Environmental Information (NCEI) based in Asheville, N.C., observations of this event remain unavailable at the time of writing. Thus the European product OSTIA is used instead as well as model simulations using an ensemble of 13 debiased CMIP6 models. A detailed description can be found in the assessment of Hurricane Helene (WWA, 2024).
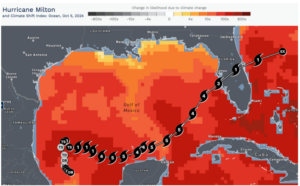
Hurricanes intensities and rapid intensification are strongly related to elevated Sea Surface Temperatures (e.g. Hong and Wu 2021). Increased Sea Surface Temperatures allow for higher levels of local humidity, atmospheric instability, and potential intensity (e.g. Emanuel, 2006). Along Milton’s track, ocean temperatures were consistently more than 1°C warmer than they would have been in a world without climate change, and were made between 400 to 800 times more likely during the intensification into a major hurricane. We conclude that warmer Sea Surface Temperatures along the track of Hurricane Milton were strongly influenced by climate change, which affected Milton’s environment and made it more likely for the storm to develop and intensify throughout its lifetime.
Vulnerability and exposure
Florida, a low-lying state with large coastal populations, faces severe risks from hurricanes, storm surges, and chronic flooding, all worsened by rising sea levels. Frequent “nuisance” flooding gradually wears down infrastructure, while hurricanes present more immediate threats. Hurricanes Helene and Milton exemplify the compounding threats and impacts of back-to-back storms. Storm surges, high winds, and heavy rainfall caused extreme flooding, widespread damage, and significant loss of life, overwhelming infrastructure and systems, especially near the coast.
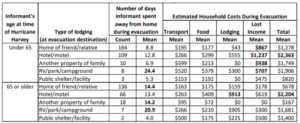
While exposure is high across coastal populations, lower-income communities and minority areas face greatest risk, due to inadequate housing and resources for adequate preparedness, evacuation, and recovery (Burnstein & Rogin, 2022; Yabe & Ukkusuri, 2020). Hurricane Milton’s approach to Florida presented significant evacuation challenges, compounded by the recent impact of Hurricane Helene. As millions of Floridans attempted to evacuate, highways became severely congested and gas stations along evacuation routes quickly ran out of fuel due to the high demand (Ebrahimji, 2024; Young, 2024). Moreover, many shelters, hotels, and rental properties were already at capacity due to Helene (Walker, 2024), and several of which are not equipped to accommodate individuals with disabilities or health issues (MacPherson-Krutsky, 2024), making it difficult for evacuees to find safe places to stay. In this context, it is important to note that 37% of Americans cannot afford a USD $400 emergency expense in cash (or equivalent) (SHED, 2023), while research by Bierling et al. (2020) found that evacuees during Hurricane Harvey spent USD $1,278 on average, and almost twice that if forced to stay in a hotel (USD $2,363) (see Table 2). Further, widespread power outages and telecommunications disruptions (Childs & Harris, 2024; FCC, 2024a; FCC, 2024b) may have hampered the dissemination of warning information and impacted the coordination of the already strained emergency response rolled out to meet the needs from Helene.
The Resilient Florida Grant Program (n.d.), established in 2021, is a state-funded initiative aimed at enhancing the capacity of local government to address the impacts of climate change. Key initiatives include vulnerability assessments and adaptation plans, such as in Miami Springs (n.d.), which includes an risk assessment of the city’s infrastructure from sea level rise, storm surges, and flooding, aiming to ensure that critical assets such as roads and utilities are protected through future capital planning, while offering a framework for adaptation strategies to improve the city’s flood resilience. Flood mitigation projects have also received substantial support, such as the planning and design of green infrastructure in Jacksonville, granted $718,809 to integrate retention ponds and expanded wetlands to manage stormwater more effectively (Groundwork Jacksonville, 2021). Additionally, Broward County (2023), where Fort Lauderdale is the main population center, received a USD $92 million grant to enhance the resilience of its infrastructure, including flood mitigation and water management improvements such as bridge upgrades, septic-to-sewer conversions, wastewater pumps, and stormwater infrastructure projects.
Following Hurricane Andrew in 1992, Florida overhauled its building codes, culminating in the 2002 Florida Building Code (FBC). The FBC introduced stricter wind-load requirements, impact-resistant windows, reinforced roofing, and improved structural connections to withstand hurricanes. Compliance and enforcement were also enhanced. Subsequent revisions, including the 2010 and 2017 editions, continued to refine these standards, placing greater focus on resilience against storm surge, flooding, and wind-borne debris (Done et al., 2018). Although Florida’s post-Andrew building code revisions were effective in protecting many structures in central and southern Florida, 2018 Hurricane Michael’s extreme winds (up to 160 mph) and storm surge showed gaps in enforcement and design standards in the Panhandle, as many structures had been constructed before the post-Andrew code reforms and some were not subject to the same stringent standards (Prevatt & Roueche, 2019; FEMA, n.d.). In response to the devastation brought by Hurricane Michael, the FBC was strengthened in 2020, making it the toughest among Gulf and Atlantic Coast states by 2021 (IBHS, 2021) and second-toughest in 2024 (IBHS, 2024). As of December 31, 2023, as per the eighth and current edition of FBC, residential buildings must withstand winds of 130-180 mph, with critical structures (such as hospitals) enduring up to 195 mph (ICC Digital Codes, 2023). Additional updates include stricter standards for roofs, exterior walls, and structural inspections to enhance flood and hurricane resistance.
Florida’s planning tends to be reactive, responding to disasters rather than preventing them (Burnstein & Rogin, 2022). The state lags behind other states in using nature-based solutions like wetland restoration and has not adequately addressed social vulnerabilities, leaving low-income and minority communities at greater risk of flood impacts (Peck et al., 2022; Burnstein & Rogin, 2022). Furthermore, gaps in coordination between state and local agencies hampers the development of cohesive, long-term flood adaptation strategies (Burnstein & Rogin, 2022). For example, Florida’s flood mitigation and planning efforts are siloed and highly decentralised. While localities are responsible for flood planning and have flexibility to adapt plans to their specific vulnerabilities, this creates gaps in coordination and oversight for statewide management. Limited coordination also extends to public engagement and resource support. Local governments, especially in low-resources areas, struggle to engage with state-level planning processes due to a lack of technical expertise and staff. As a result, many localities are left out of the larger flood planning framework (Burnstein & Rogin, 2022).
While significant progress has been made in Florida on hurricane preparedness, the severity and compounding nature of recent hurricanes still creates significant impacts and reveals shortcomings in the current flood risk management systems. Addressing social vulnerabilities, improving coordination between local and state agencies, and increasing investment in nature-based solutions are essential. Enhancing public participation in planning, making better use of predictive models, securing long-term funding for resilience, and integrating strategies for both chronic flooding and extreme events will be critical to reducing future flood risks (Peck et al., 2022; Ghanbari et al., 2020; Burnstein & Rogin, 2022; Han & Mozumder, 2022).
Hurricanes and Climate Change
The North Atlantic (NA) hurricane season lasts from June-November and on average approximately 1-2 hurricanes make landfall in the US each year (NOAA, 2024). Hurricanes are some of the costliest disasters and between 1900-2017 there were 41 events that caused at least US$3 bn in damage (when adjusted to 2017 dollars), with the three most destructive events exceeding US$100 bn each (NHC, 2017; NHC, 2022). While the increasing trend in damage due to such events is most strongly linked to increases in exposed assets to date, clearly any influence of climate change upon such events is of crucial societal relevance.
On a global scale, recent decades have seen an increase in more intense TCs (category 3-5 on the Saffir-Simpson scale), but no change in the overall number of TCs (Masson-Delmotte et al., 2021). Attribution studies on recent dangerous hurricanes in the NA basin show that rainfall from these events were all amplified by anthropogenic climate change: Katrina in 2005 by 4%, Irma in 2017 by 6%, Maria in 2017 by 9% (Patricola and Wehner, 2018), Florence in 2018 by 5% (Reed et al., 2020), Dorian in 2019 by 5-18% (Reed et al., 2021), Ian in 2022 by 18% (Reed et al., 2023), Harvey in 2017 by 7-38% (e.g. van Oldenborgh et al., 2017), and Helene in 2024 by 10% (WWA, 2024). There is also growing evidence that hurricanes are now intensifying more rapidly (Bhatia et al., 2019), becoming more intense (WWA, 2024; Grantham Institute, 2024) and will continue to do so with further warming (Patricola and Wehner, 2018), and that storm surges are causing extra damage due to sea level rise (Strauss et al., 2021).
Appendix
A.1 Observational data
- The European Centre for Medium-Range Weather Forecasts’s 5th generation reanalysis product, ERA5, is a gridded dataset that combines historical observations into global estimates using advanced modelling and data assimilation systems (Hersbach et al., 2020). We use daily precipitation data from this product at a resolution of 0.25°, from the years 1950 to present. When the analysis was undertaken, reanalysis data was not yet available and given the complexity of the meteorology, the analysis data was not deemed reliable. As a result, the event itself was not included in this dataset, though it is still used to analyse trends over time.
- We use CPC daily precipitation for the contiguous US region. This is the gridded product from NOAA PSL, Boulder, Colorado, USA known as the CPC Global Unified Daily Gridded data, available at 0.25° x 0.25° resolution, for the period 1979-present. Data are available from NOAA.
- The Multi-Source Weighted-Ensemble Precipitation (MSWEP) v2.8 dataset (updated from Beck et al., 2019) is fully global, available at 3-hourly intervals and at 0.1° spatial resolution, available from 1979 to ~3 hours from real-time. This product combines gauge-, satellite-, and reanalysis-based data.
- CHIRPS: The rainfall product developed by the UC Santa Barbara Climate Hazards Group called “Climate Hazards Group InfraRed Precipitation with Station data” (CHIRPS; Funk et al. 2015). Daily data are available at 0.05° resolution, from 1981-31 August 2024. The product incorporates satellite imagery with in-situ station data.
- As a measure of anthropogenic climate change we use the (low-pass filtered) global mean surface temperature (GMST), where GMST is taken from the National Aeronautics and Space Administration (NASA) Goddard Institute for Space Science (GISS) surface temperature analysis (GISTEMP, Hansen et al., 2010 and Lenssen et al. 2019).
A.2 Results for Hurricane Helene
| Dataset | Coastal region 2-day extreme rainfall | GMST trend | ||
| Magnitude
(mm) |
Return period (95% C.I.) | Probability Ratio | Change in magnitude (%) | |
| CPC | 93.5 | 5.8 (2.9 – 15.1) | 2.0 (0.5-10) | 19.3 (-14.6 – 71.8) |
| MSWEP | 95.7 | 7.3 (2.7 – 23.4) | 1.8 (0.2 – 130.7) | 15.2 (-40.6 – 109.1) |
| CHIRPS* | 84.7 | 7 | 5.8 (0.1 – inf) | 20.8 (-29.2 – 103.2) |
| ERA5* | 89.7 | 7 | 2.8 (1.0 – 11.2) | 31.2 (1.1 – 78.1) |
Table A.1: Change in probability ratio and magnitude for extreme rainfall in the coastal region in which Helene made landfall, due to GMST. Light blue indicates a wetting trend that crosses no change, dark blue indicates a statistically significant wetting trend, and grey indicates that the value is not used for subsequent analysis. *ERA5 and CHIRPS did not have the event included in the fit and instead were evaluated for a 7-year return period event.


